It’s pretty wild when you start thinking about how much technology has changed, isn’t it? We’re talking about a real timelapse of technology, going from simple wooden blocks to complex digital creations. This article takes a look at how we’ve gone from just imagining data to actually holding and interacting with it. It’s a journey through different ways people have tried to make information more visible and understandable, often in really creative ways. Think of it as a visual history lesson, but way more interesting than just reading a book.
Key Takeaways
- Early on, people made physical models to understand things like geometry, showing a desire to touch and see information.
- The idea of making data visible took off with physical representations, like ambient displays and models of brain slices, moving beyond just screens.
- People started making data interactive and animated, using things like hand-cranked graphs and toolkits for DIY visualizations.
- Tangible interfaces, like LEGO calendars and rearrangeable charts, let us physically move and sort data, making it more hands-on.
- More recently, data is being shown through dynamic sculptures, drone swarms, and even knitted tapestries, showing a blend of art, craft, and technology.
Early Explorations In Tangible Data
Before we had screens and pixels, people were already trying to make data something you could touch and feel. It sounds a bit wild, right? But think about it – how else could you really get a handle on numbers or information that felt too big or abstract?
George Adams’ Solid Geometry Models
Back in the day, like way before computers, people like George Adams were building physical models to show geometric ideas. These weren’t just drawings; they were actual, solid shapes. Imagine trying to explain complex math without a computer – you’d probably want something you could hold, turn around, and really see from all sides. Adams’ work was about making these abstract concepts concrete, so you could actually interact with them. It’s like the very first step towards making data something you could physically explore.
Barbeu-Dubourg’s Machine Chronologique
Then you have folks like Barbeu-Dubourg, who created this thing called the ‘Machine Chronologique’ in the 18th century. This wasn’t just a clock; it was a way to visualize time and historical events in a physical, mechanical way. Think of it as a giant, intricate machine that showed you how different events lined up. It was a complex contraption designed to make history tangible and understandable through movement and physical arrangement. It’s a fascinating example of trying to represent something as fluid as time using gears, levers, and physical components. It really shows how far back the idea of making data physical goes.
The Dawn Of Physical Visualizations
Before we got really good at making screens do fancy things with data, people were already trying to make information you could touch and see in the real world. It wasn’t about pixels on a screen; it was about actual objects. Think of it as data you could hold, move around, or even walk through.
eCLOUD & airFIELD: Ambient Airport Visualizations
Imagine walking through an airport and seeing lights or subtle movements that tell you about flight statuses or passenger flow. That’s the idea behind projects like eCLOUD and airFIELD. Instead of staring at a static screen, the environment itself gives you a sense of the data. It’s like the building is breathing information. This approach aims to make data less intrusive but still present, blending it into our surroundings.
Limbique: Brain Slices
This project took brain scan data and turned it into physical slices. It’s a way to represent complex biological information in a tangible form. By creating these physical representations, researchers and perhaps even the public could get a different feel for the structure of the brain. It’s a bit like looking at a 3D model, but made from the actual data itself.
Relational Ornaments: Networks Shown with Textile
This is a really neat idea where data networks, like social connections or system links, are shown using textiles. Think of it as data woven into fabric. Each thread or knot could represent a connection or a data point. It turns abstract network structures into something you can see and feel, like a piece of art or jewelry. It’s a way to bring the complexity of networks down to a more human, craft-based scale.
Interactive And Animated Data Representations
Moving beyond static displays, this section looks at how data can come alive through movement and interaction. It’s about making information dynamic, not just something you look at, but something you can engage with. Think about how a simple graph can tell a much richer story when it’s animated or when you can actually touch and change it.
Manually Animated Graph of Scientific Data
Imagine a physical graph that actually moves when you turn a crank. That’s exactly what artist Bradley Litwin created back in 2011. Commissioned by a pharmaceutical company, this device was meant to help doctors understand scientific data more easily. It uses a clever system of cams and followers. As you turn the crank, these cams rotate, and their unique profiles, based on the data points, push indicators up and down along a linear axis. The speed at which you turn the crank even controls a time display, acting as the X-axis. It’s a fantastic example of how mechanical ingenuity can bring abstract data into the physical world. This approach makes complex scientific information more accessible and memorable.
Jose Duarte’s Handmade Visualization Toolkit
Jose Duarte, a designer from Colombia, had this great idea: what if anyone could build their own physical data visualizations? He wanted to bring a DIY spirit to the field. Using everyday stuff like balloons, tape, and rubber balls, he experimented with all sorts of charts – from simple bar graphs to more complex bubble charts. To make it easier for others, he even designed a special toolkit. This toolkit provides the basic materials and instructions needed to create these hands-on data representations. It’s all about making data visualization a more personal and creative process, whether for business, art, or even just for fun. You can see some amazing examples of 3D animated visualization videos that tell stories in different ways online.
Here’s a quick look at what Duarte’s toolkit might help you build:
- Area Charts: Representing data values by the area of shapes.
- Bubble Graphs: Using the size and position of bubbles to show relationships.
- Venn Diagrams: Illustrating logical relationships between sets of data.
This hands-on approach encourages a different kind of understanding, one that’s tactile and memorable. It shows that you don’t need fancy software to make data meaningful.
Tangible Interfaces For Data Exploration
Sometimes, looking at data on a screen just doesn’t cut it. That’s where tangible interfaces come in. These are ways to interact with information using physical objects, letting you touch, move, and rearrange things to get a better feel for the data. It’s like building with data instead of just looking at it.
Rearrangeable 3D Bar Chart
Imagine a bar chart you can actually pick up and move around. That’s the idea behind the rearrangeable 3D bar chart. Instead of clicking and dragging on a computer, you can physically sort, filter, and compare data by just moving the pieces. This hands-on approach can make understanding complex datasets a lot easier. It’s a modular system, meaning you can build and change it as needed.
Putting Physical Visualizations to the Test
So, do these physical charts actually work better than what’s on a screen? Researchers have put them to the test. In studies, physical bar charts showing how country indicators changed over time were found to be more effective for retrieving data than their digital counterparts. It seems that being able to physically interact with the data can really make a difference in how well we understand it.
Bit Planner – LEGO Calendar
This project takes a common toy, LEGO bricks, and turns it into a functional calendar. Each brick can represent a day or a task, and you can build your schedule physically. It’s a fun, visual way to plan your time, and you can see your week or month laid out in front of you. It shows how everyday objects can be repurposed to make data more accessible and engaging.
Here’s a quick look at how different physical visualizations have been explored:
- Centograph (2009): Ten moving bar charts showing how popular certain keywords were in news articles over time. You could search for topics and see their trends physically.
- Distribution Plushies (2009): While not strictly visualizations, these stuffed toys could be made to represent different data distributions, making abstract concepts more concrete.
- DataMorphose (2009): An installation where data streams were shown as moving sails in a room, creating a dynamic, physical representation of information.
- CNC-Milled Wood Visualization (2017): This project turned a studio’s energy usage data into a carved wooden sculpture, making abstract energy consumption a solid, observable object.
- Fabricating Physical Globe Visualizations (2017): Using 3D printing, researchers created physical models of the Earth to display complex geospatial data in a more understandable way.
Dynamic Sculptures And Swarms
Sometimes, data visualization moves beyond flat screens and static objects. It takes on a life of its own, becoming a dynamic sculpture or a coordinated swarm. These projects turn abstract information into physical, moving art.
Large-Scale Drone Swarm
Imagine tiny robots, like the "Cetonia" scarabs envisioned for 2033, flying in formation. These aren’t just for show; they could be used to gather and display data right in the real world. Each little drone, just over half an inch wide, is built for agile flight. They can stay airborne for over 15 minutes and have special shells that can show millions of colors, making them visible day or night from a good distance. With cameras and sensors, they can map out areas and even interact with things. You could send them out from a wrist device or a small station to survey, measure, and record information, essentially bringing data visualization into the air.
Dynamic Network Sculpture
Think about representing complex relationships, like those in cultural heritage data, as a physical, moving structure. The "Cultural Heritage Cube" is an example of this. It’s a physical representation of data over time and space, turning abstract connections into a tangible form that can be explored. It’s like building a physical map of how things are connected, but with the added dimension of movement and change.
Point Cloud: A Dynamic Weather Sculpture
This concept takes weather data and turns it into a constantly changing physical form. Instead of just looking at a weather map on a screen, imagine a sculpture that physically shifts and moves to show temperature, wind, or precipitation. It could be a collection of elements that react to real-time weather information, creating a living, breathing representation of atmospheric conditions. This approach makes the invisible forces of nature visible and tangible.
Materializing Data Through Craft And Fabrication
Sometimes, data feels so fleeting, right? Like it just floats around in the digital ether. But what if we could grab it, shape it, and make it something solid, something you can actually hold? That’s what this section is all about – taking abstract information and turning it into physical objects using traditional crafts and modern fabrication techniques.
Think about it. Instead of just seeing numbers on a screen, imagine knitting your personal debt and assets into the shape of a teapot, like Courtney Starrett did with her "Modern Dowry" project. It’s a really neat way to connect personal finance with art. Or consider Elias Thaddäus Pfuner’s work, where he used a CNC machine to carve a studio’s energy usage from walnut wood. This approach makes complex data not just visible, but also persistent and quite persuasive.
Here are a few ways people have been making data tangible:
- Punchcard Economy: Data Knitting: This project takes the idea of old-school punch cards and translates data into knitted patterns. It’s a way to represent economic or system data using a craft that’s been around for ages, giving it a warm, tactile feel.
- Loci: 3D Printed Sculptures of Your Flights: Imagine having a 3D model of all your travels. This project uses 3D printing to create sculptures based on flight data, turning your journeys into a physical object you can display.
- A Snow Chart of Mobility in Science: This is a really interesting one where scientific mobility data is visualized as a physical chart that looks like a landscape. It uses materials to represent movement and connections within the scientific community, making it easier to grasp.
These projects show that data doesn’t have to stay confined to computers. By using things like knitting, 3D printing, and even woodworking, we can create physical representations that tell stories, spark conversations, and give us a whole new way to interact with information.
Future Visions In Data Visualization
Travels on the Wind
Imagine looking back at a decade of your own life, not through photos or a diary, but as a physical object. That’s what ‘Travels on the Wind’ does. It’s a piece that uses threads and beads to show a whole ten years of travel. Each year gets its own thread, and little rings and beads on it tell you about how long trips were, where you went, what time of year it was, how you traveled, where you stayed, and who you were with. It took months to make, using 3D printed bits, jewelry parts, and some special resin. Hung up on a piece of driftwood, it’s like a personal story you can actually touch.
Monarch Butterfly Migration
This one is pretty neat. At IDEO Chicago, they set up a wall that changes based on the yearly Monarch butterfly migration. The more butterflies there are in Mexico, the more wings open up on the wall. It’s a simple way to get a feel for how the population is doing each year, just by looking at a wall. It connects us to this amazing natural event in a really visual way.
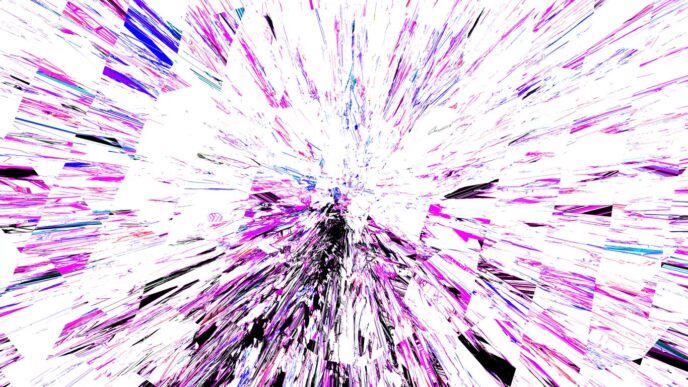
Digitally-Fabricated Visualizations of the Future
Looking ahead, things are going to get even more wild. Think about what happens when we get really good at making things with computers and machines. Artist Lee Griggs has shown us a glimpse of this with his computer-generated images. They aren’t actual data visualizations yet, but they show us what’s possible. We’re talking about visualizations that are incredibly detailed, full of color, and feel almost real. Imagine data not just on a screen, but as complex, beautiful objects that you can see and maybe even feel. It’s like data art that’s built with the precision of future technology.
Looking Ahead
So, we’ve seen how tech has gone from simple geometric shapes to complex AI-generated art and interactive displays. It’s pretty wild to think about how fast things change. What started as basic models and timelines has exploded into these amazing, tangible pieces that show us data in totally new ways. It makes you wonder what’s next, right? Will we be interacting with data through even more senses, or will the digital world become so advanced it feels completely real? One thing’s for sure, the journey is far from over, and it’s going to be interesting to see where it all leads.
Frequently Asked Questions
What is data visualization?
Data visualization is like creating pictures or models from information. Instead of just looking at numbers or text, we turn data into something we can see and understand more easily, like charts, graphs, or even physical objects.
How has technology changed data visualization?
Technology has made data visualization way more advanced. We’ve gone from simple drawings to complex computer programs that can create interactive and animated displays. Now, we can even make physical objects that represent data, using things like 3D printing and robotics.
What are ‘tangible’ data visualizations?
Tangible data visualizations are physical objects that represent data. Think of a sculpture made from LEGOs showing how busy a project is, or a knitted pattern representing work hours. You can touch and interact with these, which can help you understand the data in a different way.
Can you give an example of an early data visualization?
Sure! Back in the 1700s, people made physical models of shapes to help teach geometry. These were like early 3D charts. Also, there were long timelines created to show historical events, which were like early visual timelines.
What’s the difference between old and new data visualizations?
Older visualizations were usually static, meaning they didn’t change or move. Think of a printed chart. Today, we can create visualizations that are interactive, meaning you can play with them, or animated, meaning they move and change over time, often showing how things evolve.
What does the future of data visualization look like?
The future looks really exciting! We’re seeing more and more creative ways to make data visual, like sculptures that change with the weather or art made from knitting. Technology like AI and advanced 3D printing will likely lead to even more amazing and immersive ways to explore information.