After a lot of struggles with the QuickBooks Online data, Vidicorp is happy to finally deliver a QuickBooks Power BI template. Hopefully it will save you time having to work out the QuickBooks Online data model and building this out yourself!
Here is what it looks like!
Available features:
- Combining data from multiple QuickBooks online accounts.
- Visualisation of your P&L statement and drilling down to specific transactions that made up the value of every account.
- Visualising Balance Sheet the same way.
- Enabling you to switch from an accrual basis to a cash basis with a click of a button.
Interested in setting it up for you? Reach out to Vidicorp now!
Use cases for this template.
This template is already set up for multiple clients of Vidi. Here is what companies around the world are using this template for.
Client 1- Patriot Holdings
This is a property company with 64 QuickBooks online accounts: 1 per property that they own. Their CFO is using this template to see a consolidated financial overview of their property portfolio in Power BI.
★★★★★
- Bernard Clevens – Principal Investment Management Specialist
Client 2 – Fringe Advisory
This is an accountancy practice with dozens of clients. Every client has their own QuickBooks account. They are using this QuickBooks Online Power BI template to provide management reporting for their clients on a monthly basis.
★★★★★ Eugene was very professional and helped with the project perfectly!
- Aaron Berson – CEO, Fringe Advisory
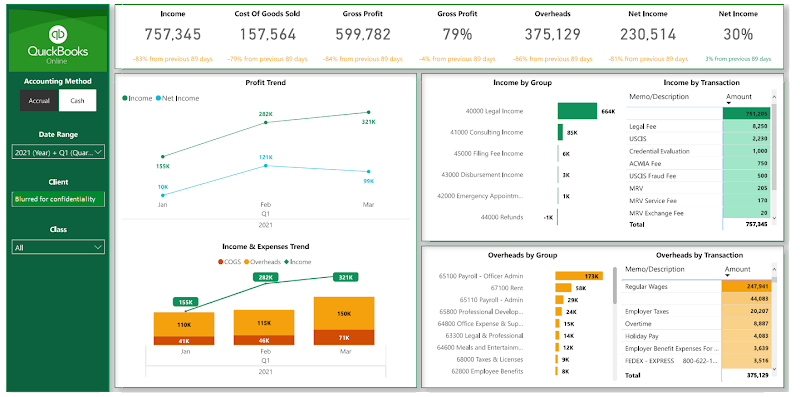
P&L Visualisation
This page of the dashboard visually presents the trends for the key metrics in your P&L dashboard. Those metrics include Income, COGS, Overheads and Net Profit.
You will also get a visual representation of the biggest income groups and overhead groups. You will also be able to drill down to specific transactions that make up the value of all the accounts.
As for filters, you will be able to switch from Accrual to Cash basis with a click of a button.
In addition, you will be able to select the Quickbooks account that you want to view with a click of a button. If you want to see all the accounts combined, this is also possible.
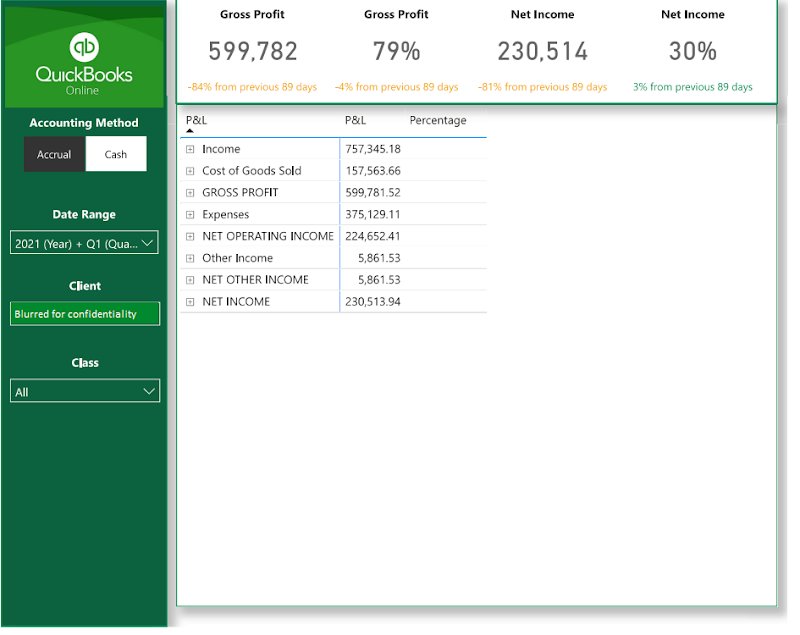
P&L Detail
This is the same view that you would see if you went to P&L Details report inside of Quickbooks.
You will also have expand/collapse functionality just like in an Excel pivot table.
Once you expand, you will see a percentage column showing you which percentage of income every income group makes.
Just like before you also have an option to drill down to specific transactions that make up the value of every account.
You can also switch between Accrual and Cash basis with a click of a button, filter to a specific QuickBooks account, and see the data for all the QuickBooks accounts combined.
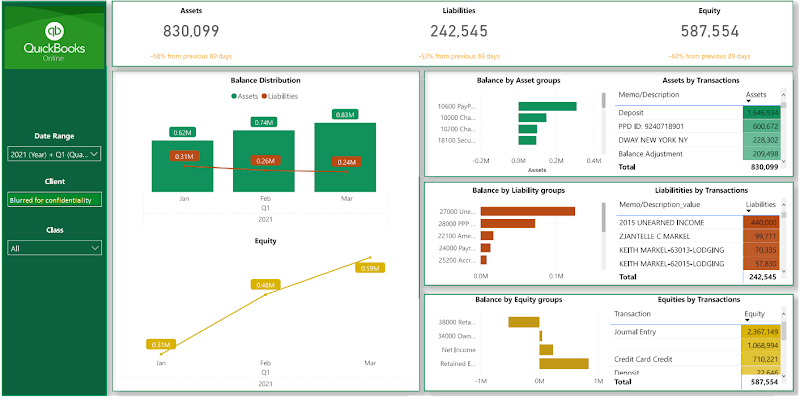
Balance Sheet Visualisation
This page visualises the Balance Sheet statement from QuickBooks Online. The main metrics like Assets, Liabilities and Equity are visualised.
You will see the trends for those metrics in the trend charts and the account groups that make up those metrics in the bar charts. Just like before, you will also see the specific transactions that make up every account.
You can also see all the QuickBooks Online accounts together and filter to individual accounts.
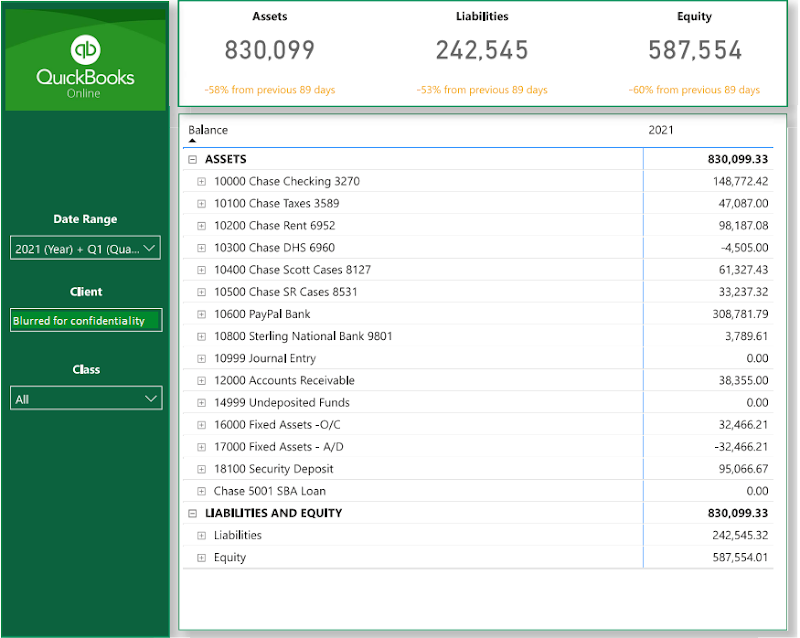
Balance Sheet Details
This page presents the same view as you would find inside of the QuickBooks Online Balance Sheet Details report. In addition to that, you can have a YoY view on a column basis.
Just like before you can drill down to transactions that make up the value of accounts.
You can also see the data for all QuickBooks accounts combined and select an individual account to see.
FAQs
How is the data extracted?
Vidicorp has developed a software that extracts data in a very convenient format. You can read more about the format of data that you will be getting in QuickBooks online connector article.
Is there a cost for the connector?
Yes, we charge a set up fee + a monthly subscription based on the number of QuickBooks accounts. There are volume discounts as well if you have a large number of QuickBooks accounts.
Do I get access to the data too?
Yes, you will be able to access the source data as well so if you wanted to build additional analysis yourself!
Vidi-corp.com, a UK-based data analytics company with 500+ clients including Google, Teleperformance, and the UK Ministry of Defense continues to help businesses visualize and make meaning out of their data.